- Vision Inspection and Sorting
- Agrocultural Systems
- Colour Vision Systems
- Label Inspection System
- Seal Check Inspection
- Vision Systems Applications
- Vision Systems Foreign Matter Detection
- AI Code Reading Systems
- Vision Sensor Application Examples
- Face Mask Inspection System
- Profile Flaw Detection
- Sachet Detection in Pots
- Detection of Missing Products in Boxes
- Batch Date Code Verification
- Missing Label Detection
- Loose Cap Detection
- Under Fill Detection
- Printed Expiration Date Verification
- Attached Straw Detection
- Hot Melt Detection on Cartons
- Chemical Vision Inspection (Hyperspectral)
- bioClass® Process Control Homogeneous Dry Powders
- bioClass® Same Colour Foreign Matter Detection in Rice
- bioClass® Herb Quality and Purity Inspection
- bioClass® Muscle Abnormalities Woody Breast Detection
- bioClass® Pathogen detection
- Food Fraud Detection
- bioClass® for Food Inspection
- bioClass® Quality Inspection Pistachio
- bioClass® Quality Inspection Almonds
- bioClass® Quality Inspection System – POULTRY
- bioClass® Date Grading System
- bioClass® Food Inspection – Non-destructive Chemical Analysis
- bioClass® Quality Inspection Detection of Low Density Plastic in Processed Meats Foods
- bioClass® Hyperspectral Quality Inspection and Sorting Systems
- Hyperspectral Applications
- SORTING MACHINES
- 2025 Vision System Applications
- Video
- Digital Concepts & VR Walkthroughs are Revolutionizing Factory Design with Automate and Control LTD
- Hyperspectral
- Posts
- Posts
- Articles
- Sustainability from bioClass®
- Never seen before BLACK HOLE imaging from NASA
- bioClass® Non-destructive Food Contamination Detection
- COVID-19 Hitting Reset on the Fast Food and Ready to Eat Sector of the Poultry Industry
- Eliminate Machine Crashes
- Using vision systems for food quality control
- Using Industrial Vision to Reject Burnt Food on a Production Line
- Archive
- Contact
- SERVICE / PARTS
- Orders
Phenotyping Solutions for Field Laboratory Greenhouse Vertical Farming
We provide turnkey airborne solutions that include, full hyperspectral data coverage from 400nm to 2500nm, VNIR+SWIR, externally mounted LiDAR, High Precision GPS/IMU and small lightweight data fusion hub to collate all your flight information on a solid stage 480GB drive.
Machine-Augmented Plant Stress Phenotyping
Unmanned Airborne Hyperspectral System with LiDAR Provides a Unique Solution for Field Phenotyping
Turnkey solutions collate, Chlorophyll Content, Modified Chlorophyll Absorption in Reflectance Index (MCARI), Normalized Difference Red-Edge Index, Normalized Difference Indices – ND705, Broadband Greenness (NDVI), Light Use Efficiency (PRI), Canopy Water Content (WBI) Automate and Control LTD. sales@automateandcontrol.co.uk.
AIRBORNE
PHENOTYPING
1Turnkey solution with including NIR SWIR GPS LiDAR
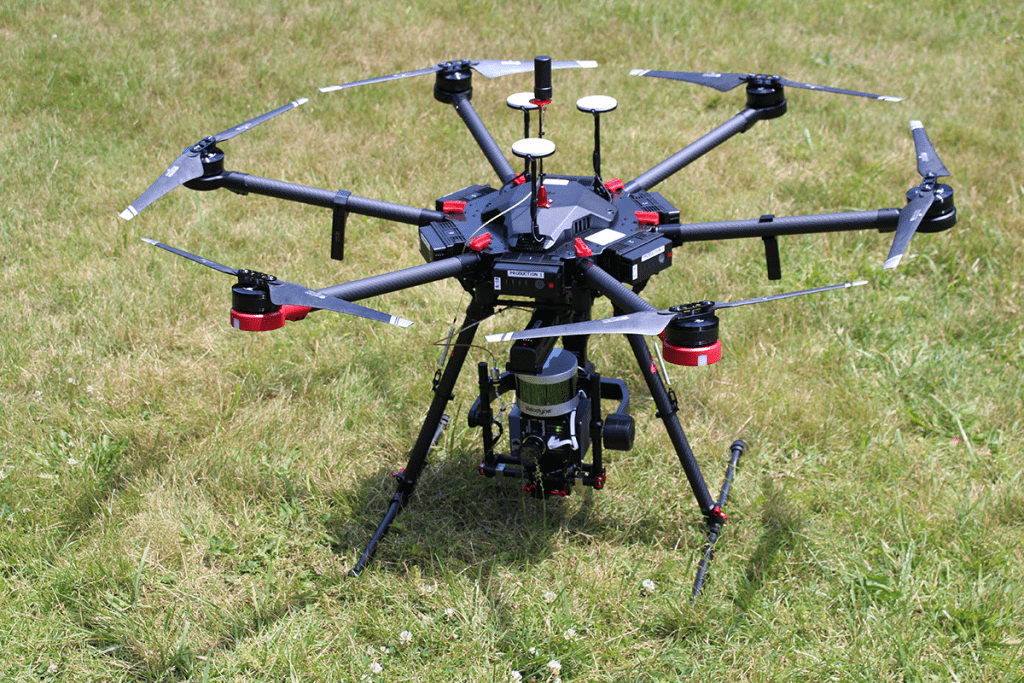
Example Airborne Solutions
VNIR + LiDAR on Stabilizing Gimbal + High-Performance GPS/IMU
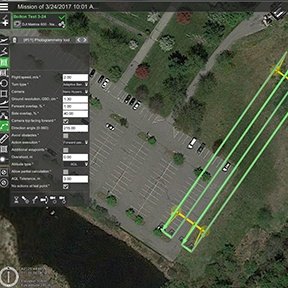
Correct and accurate remote sensing missions start with flight planning. Several software applications available, including a Polygon Tool that allows the user to determine the precise GPS points within which the drone with a hyperspectral camera will operate.
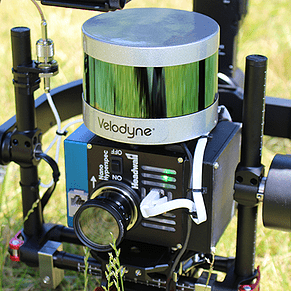
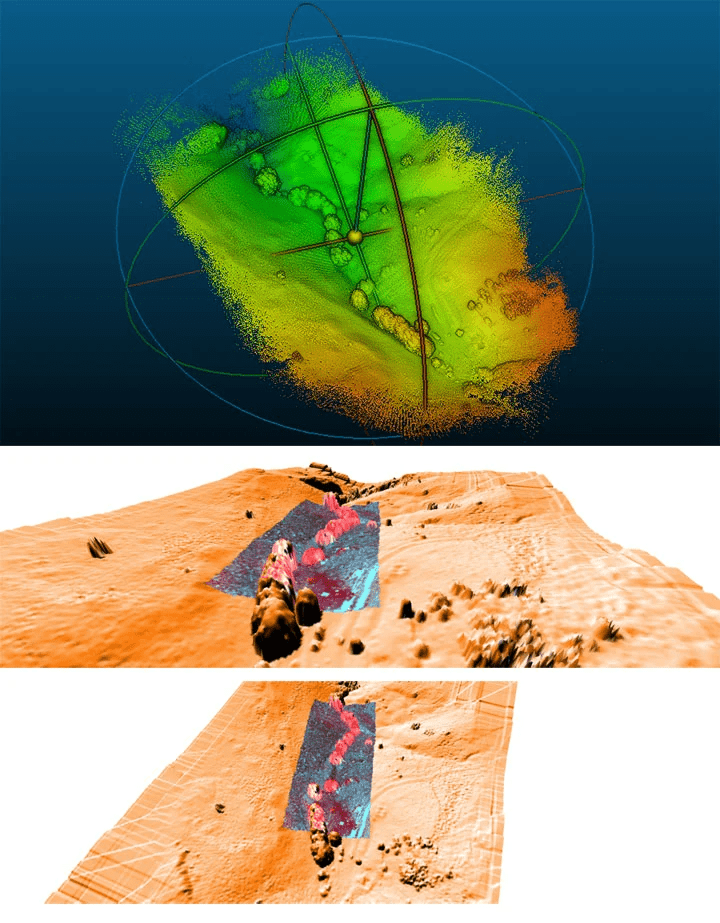
Aerial LiDAR is useful for forest mapping and crop-health analytics by providing information on plant height and density. Combining hyperspectral and LiDAR allows for more efficient flying since both data sets can be collected simultaneously. It also provides a more complete picture of how the landscape looks with respect to structure and vegetation types.
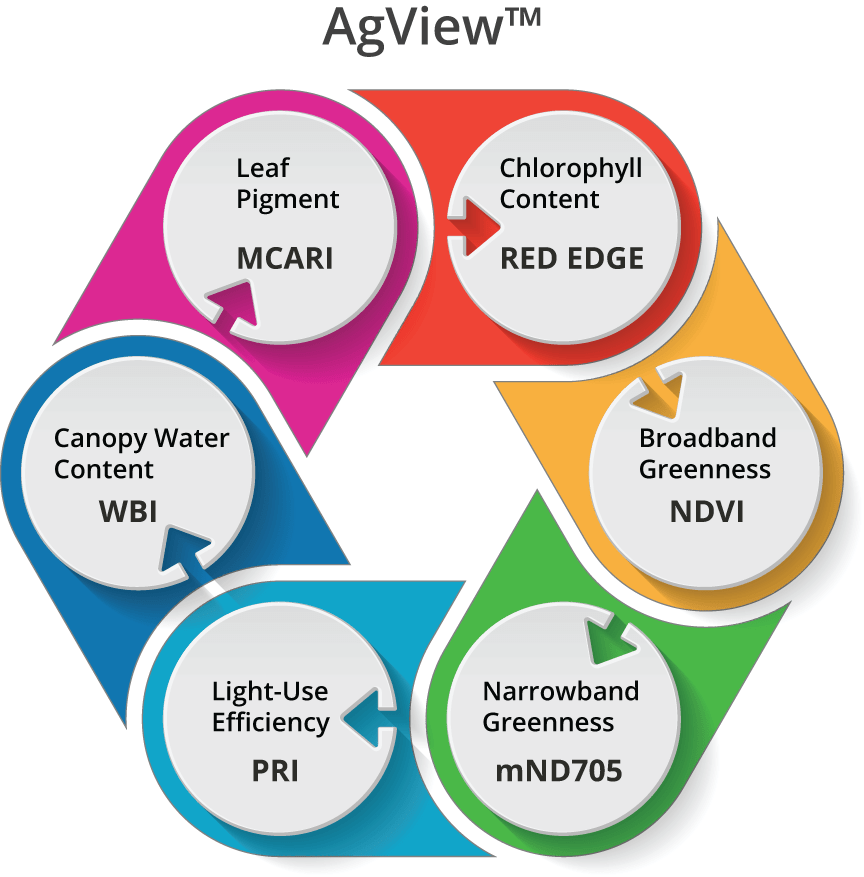
The Vegetative Indices
Broadband Greenness indices describe the vigor and health of green vegetation. They result from reflectance measurements that are sensitive to the combined effects of foliage chlorophyll concentration, canopy leaf area, foliage clumping, and canopy architecture. These Vegetation Indices are designed to provide a measure of the overall amount and quality of photosynthetic material in vegetation, which is essential for understanding the vitality of the vegetation. For these VIs, the strong reflective properties in the NIR wavelengths are compared with the strong absorption features of vegetation in the red wavelengths.
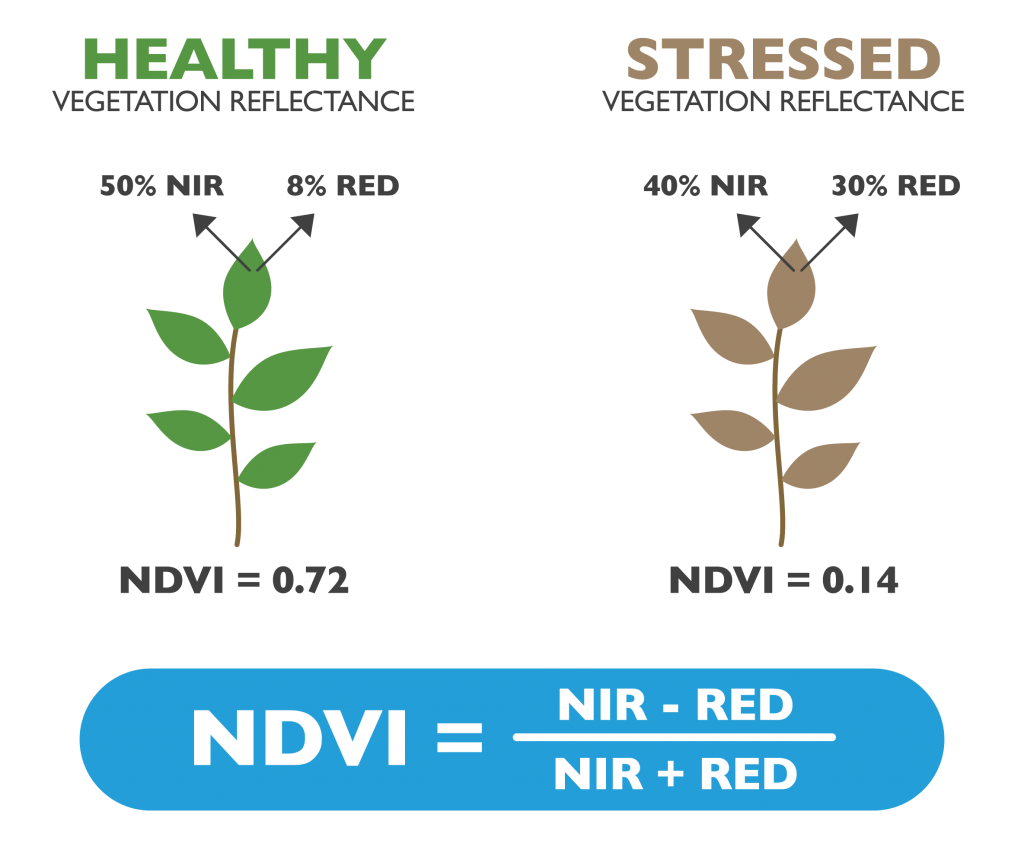
Normalized Difference Vegetation Index (NDVI) is perhaps the most well-known and frequently used vegetation index. The NDVI is a simple but effective VI for quantifying green vegetation and total active leaf area. The NDVI normalizes green leaf scattering in the NIR region and chlorophyll absorption in the red region.
NDVI = (NIR – RED) / (NIR + RED). Healthy vegetation generally falls between values of 0.20 to 0.80 on an index range of -1 to 1.
Light Use Efficiency represents a way to quantify the ability of vegetation to use incident light for photosynthesis. Considering the broad electromagnetic spectrum, only a small range is actually utilized by plants during photosynthesis. This range happens to fall within the visible portion of the spectrum, from 400nm to 700nm. A plant’s ability to efficiently absorb energy within this range can be a good predictor of growth rate and biomass production.
Photochemical Reflectance Index (PRI) is a reflectance measurement of carotenoid pigments, specifically the xanthophyll pigments (yellows) that are present in live foliage. These pigments indicate photosynthetic light use efficiency and are useful for measuring vegetation health prior to senescence.
PRI = (531nm – 570nm) / (531nm + 570nm). The values of this index are typically -0.2 to 0.2 on an index range of -1 to 1.
Chlorophyll Content is an important measurement found by measuring the Oxygen-A and Oxygen-B bands at high resolution. Headwall’s chlorophyll fluorescence imaging sensor targets the very narrow passband from 670-780nm, but does so with exceptionally high FWHM spectral resolution between 0.1-0.2nm. This allows the sensor to collect data present in the Oxygen-A and Oxygen-B bands where these weak signals are found.
With this data, environmental scientists can gain a better understanding of plant physiology and stress in near real-time.
Narrowband Greenness is similar to Broadband Greenness but is designed to provide a measure of the overall amount and quality of photosynthetic material in vegetation. These VI’s use reflectance measurements in the red and NIR regions to sample the red-edge portion of the reflectance curve. The red-edge is a name used to describe the steeply sloped region of the reflectance curve between 690nm and 740nm, which is caused by chlorophyll absorption and near-infrared scattering.
Use of NIR wavelengths, offering much greater penetration depth through the canopy than red wavelengths, allows estimation of the total amount of green material in the column. Narrowband Greenness VI’s are more sophisticated measures of general quantity and vigor of green vegetation than Broadband Greenness. Narrowband measurements in the red edge allow these indices to be more sensitive to smaller changes in vegetation health than the Broadband Greenness VI’s, particularly in conditions of dense vegetation where the broadband measurements can saturate.
Canopy Water Content indices are designed to measure water contained in the foliage canopy. Higher water content often indicates healthier vegetation that is likely to grow faster and be more fire-resistant. Canopy water content VI’s use reflectance measurements in the near-infrared (NIR) and shortwave infrared (SWIR) regions to take advantage of known absorption features of water and the penetration depth of light in the near-infrared region. The result is an integrated measurement of total column water content. Compared to greenness VI’s, canopy water content indices are able to “see” more deeply into thick canopies and have a preferential sensitivity to thin as opposed to thick tissues.
Water Band Index (WBI) is a reflectance measurement that is sensitive to changes in canopy water content. As the water content of vegetation canopies increases, the strength of absorption around 970nm increases relative to 900nm. Applications of the WBI include canopy stress analysis, productivity prediction and modeling, fire hazard condition analysis, cropland management, and studies of ecosystem physiology.
WBI = 900nm / 970nm. The value of this index are typically 0.8 to 1.2 on an index range of 0 to 2.
Leaf Pigment VI’s are designed to provide a measure of stress-related pigments present in vegetation. Stress-related pigments include carotenoids (yellow pigments) and anthocyanins (pink, purple and red pigments). These tend to be present in higher concentrations when vegetation is in a weakened state. Carotenoids function in light absorption processes in plants, as well as in protecting plants from the harmful effects of high-light conditions. Anthocyanins are water-soluble pigments abundant in newly-formed leaves and leaves undergoing senescence. The leaf pigment vegetation indices do not measure chlorophyll, which is instead measured using the greenness indices. Applications for leaf pigment vegetation indices include crop monitoring, ecosystem studies, analyses of canopy stress, and precision agriculture.
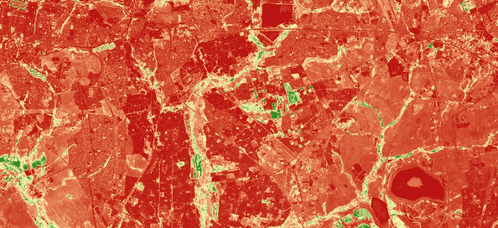
Carotenoid Reflectance Index 1 (CRI1) is a reflectance measurement that is sensitive to carotenoid pigments in plant foliage. Estimation of leaf carotenoid content from reflectance is much more difficult than estimation of chlorophyll because of the overlap between chlorophyll and carotenoid absorption peaks, and because of the higher concentration of chlorophyll than carotenoid in most leaves. At 510nm, the reciprocal reflectance of carotenoid is maximal, but this value is also influenced by chlorophyll. To remove the effect of chlorophyll, the reciprocal reflectance at 550nm is used, which is influenced more purely by chlorophyll alone. Higher CRI1 values mean greater carotenoid concentration relative to chlorophyll.
CRI1 = (1/510nm) – (1/550nm). The value of this index is typically 1 to 12 on a range from 0 to >15.
![Carotenoid content estimation in a heterogeneous conifer forest using narrow-band indices and PROSPEC[...]](https://www.automateandcontrol.com/wp-content/uploads/2021/05/Screenshot_2021-05-02-Carotenoid-content-estimation-in-a-heterogeneous-conifer-forest-using-narrow-band-indices-and-PROSPEC....png)